How to Trace a Multi-Agent System
You deployed 50 agents. One of them hallucinated. How do you find it? The engineering guide to OpenTelemetry, W3C Trace Context, and Agentic FinOps.

The Black Box Swarm: Distributed Tracing for AI
On Tuesday, we established that the “Omni-Agent” is dead. We replaced unstructured chat loops with the A2A Protocol, teaching our micro-agents to pass strict, deterministic JSON contracts (the “locked briefcase”) back and forth to execute complex enterprise workflows.
But Tuesday’s architecture introduced a terrifying new reality: You no longer have a single application. You now have a highly distributed, asynchronous network of LLMs making autonomous decisions, spawning sub-tasks, and mutating state across dozens of different infrastructure boundaries.
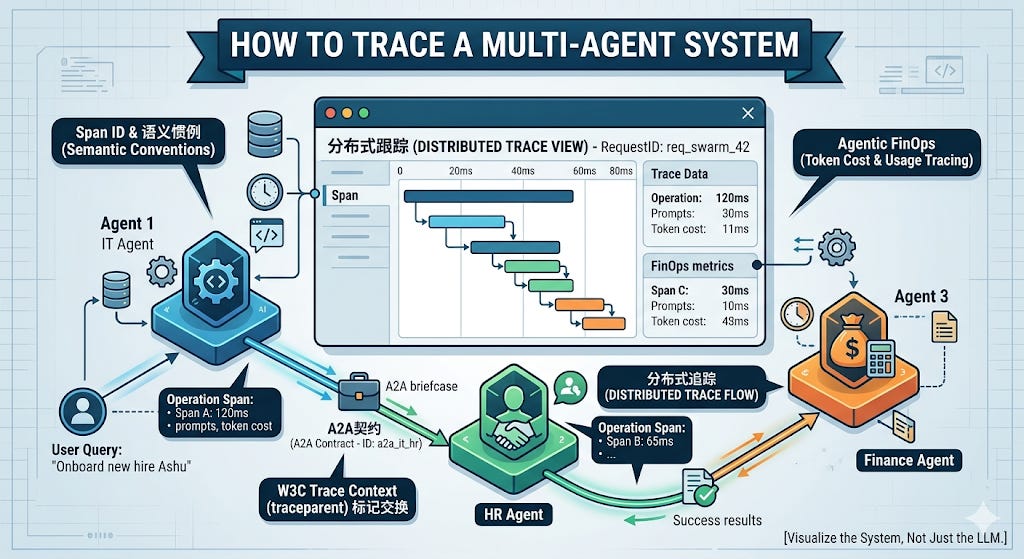
When your Onboarding Agent delegates a task to the IT Agent, which delegates a database lookup to the Azure Permissions Agent... and the final result is a catastrophic hallucination that provisions the wrong AWS keys—how do you debug it?
If your answer is “I check the LangSmith logs,” you are missing the forest for the trees. LangSmith is phenomenal for debugging one LangGraph agent. But in a multi-agent A2A enterprise swarm, your agents don’t all live in LangChain. Some are built in Microsoft Copilot Studio. Some are in AWS Bedrock. Some are custom Python scripts running on edge devices.
Today, we are bringing hardcore Site Reliability Engineering (SRE) to Agentic AI. We are going to implement Distributed Semantic Tracing. We will break down how to use OpenTelemetry (OTel) and W3C Trace Context to track a single user request across a massive, multi-vendor AI swarm, and finally solve the biggest blind spot in enterprise AI: Agentic FinOps.
Chapter 1: The Death of the Print Statement
In traditional software, if an API fails, you grep the server logs for the ERROR tag.
In Agentic AI, systems rarely throw hard errors. LLMs fail silently. They execute the function perfectly, return a 200 OK status code, and confidently output completely fabricated garbage. Because the A2A network successfully passed the JSON contract, your infrastructure thinks everything is fine.
To debug a swarm, you don’t just need to know if a node executed; you need to know what it was thinking. You need to capture the exact prompt, the temperature, the token count, and the exact tool payload that was generated at every single hop of the A2A journey.
You cannot do this with custom logging. You must adopt OpenTelemetry (OTel), the open-source observability framework used by Datadog, Grafana, and Honeycomb.
Chapter 2: The W3C Trace Context (Tagging the Briefcase)
To track an autonomous workflow across multiple isolated agents, you must give the workflow a globally unique fingerprint. In distributed systems, this is called the traceparent.
Remember the A2A JSON payload we built on Tuesday? We are going to modify our API gateway to inject standard W3C tracing headers into the briefcase before we hand it to the next agent.
Python
# The A2A Payload from Agent A to Agent B
{
  "caller_identity": "urn:agent:hr_onboarding",
  "intent": "PROVISION_GITHUB",
  "parameters": {"email": "ashu@company.com"},
  "max_hops": 2,
  # THE NEW OBSERVABILITY LAYER
  "traceparent": "00-4bf92f3577b34da6a3ce929d0e0e4736-00f067aa0ba902b7-01"
}
This 55-character string is the most important debugging tool in your entire stack.
The first big chunk (
4bf92...) is the Trace ID. It represents the entire multi-agent workflow.The second chunk (
00f06...) is the Span ID. It represents Agent A’s specific step.
When Agent B receives this JSON contract, its FastAPI server extracts the traceparent. As Agent B boots up its LLM to process the request, it attaches that exact same Trace ID to its own telemetry.
Now, when you open Datadog, you don’t see isolated, chaotic AI logs. You see a beautiful, interconnected waterfall graph showing exactly how the task cascaded from HR, to IT, to AWS, millisecond by millisecond.
Chapter 3: Instrumenting the LLM Span
Now that we are passing the Trace ID, we need to actually record the cognitive work the agent is doing.
We don’t just want to measure API latency. We want Semantic Conventions. OTel has recently introduced standard attributes for Generative AI. We need to wrap our agent’s execution block to capture the exact prompt and response.
Here is what hardcore agentic observability looks like in Python:
Python
from opentelemetry import trace
from opentelemetry.trace.propagation.tracecontext import TraceContextTextMapPropagator

tracer = trace.get_tracer(__name__)

@app.post("/api/v1/a2a/execute")
async def handle_agent_request(payload: dict):

    # 1. Extract the Trace Context from the incoming A2A briefcase
    carrier = {"traceparent": payload.get("traceparent")}
    context = TraceContextTextMapPropagator().extract(carrier=carrier)

    # 2. Start a new Span linked to the global Trace ID
    with tracer.start_as_current_span("agent_execution_node", context=context) as span:

        # 3. Add GenAI specific Semantic Attributes
        span.set_attribute("gen_ai.system", "openai")
        span.set_attribute("gen_ai.request.model", "gpt-4o")
        span.set_attribute("a2a.intent", payload.get("intent"))

        # 4. Invoke the Graph / LLM
        result = llm_agent.invoke(payload["parameters"])

        # 5. Capture the cognitive output and FinOps metrics
        span.set_attribute("gen_ai.response.model", result.model_used)
        span.set_attribute("gen_ai.usage.input_tokens", result.usage.prompt_tokens)
        span.set_attribute("gen_ai.usage.output_tokens", result.usage.completion_tokens)

        # Capture the reasoning trace for debugging hallucinations
        span.add_event("Agent Reasoning Log", {"content": result.reasoning_text})

        return {"status": "success", "data": result.tool_calls}
If the agent hallucinates, an SRE can click into the Datadog trace, expand the span, and read the exact Agent Reasoning Log to see why the LLM made the wrong decision.
Chapter 4: Agentic FinOps (The Chargeback Problem)
This brings us to the ultimate crisis of enterprise swarms: The Cloud Bill.
When you had one chatbot, you paid one OpenAI bill. When you have a swarm of 50 autonomous agents constantly negotiating, summarizing, and planning in the background, your token consumption scales quadratically.
Workflows that cost $0.05 to test on your laptop will silently burn $50,000 a month in production as agents dynamically spawn sub-tasks to resolve edge cases.
When the CFO looks at the AWS Bedrock bill at the end of the month, they are going to ask: “Which department is responsible for this $50,000 spike?”
If you aren’t using OTel and Trace Context, you cannot answer them.
But look back at the code block in Chapter 3. Notice these lines?
Python
span.set_attribute("gen_ai.usage.input_tokens", result.usage.prompt_tokens)
span.set_attribute("gen_ai.usage.output_tokens", result.usage.completion_tokens)
Because we linked the token usage to the global Trace ID, and we know the caller_identity from the A2A payload, we have achieved Agentic FinOps.
You can now build a Grafana dashboard that aggregates token burn by the initiating intent. You can walk into an executive meeting and say: “The automated HR Onboarding workflow initiated 14,000 multi-agent interactions this month, spanning 4 different departments, and consumed a total of $12,400 in inference costs. We are charging that back to the HR department’s budget.”
That is the difference between a toy AI project and an enterprise-grade AI deployment.
The Executive Mandate: If You Can’t Trace It, You Can’t Trust It
The AI industry has spent the last two years obsessing over “evals” and “benchmarks” for isolated models. This is no longer enough.
In a multi-agent world, evaluating the model is easy. Evaluating the system is the hard part. The friction is no longer in the LLM’s reasoning capabilities; the friction is in the handoffs.
If you are scaling a multi-agent architecture without implementing OpenTelemetry distributed tracing, you are flying a 747 completely blind. When the swarm eventually misbehaves—and it will—you will have zero diagnostic capability to find the rogue agent.
Stop relying on print statements.
Stop guessing which agent hallucinated.
Instrument your A2A contracts, track your token burn, and bring hardcore observability to your AI stack.
Over to you: How is your team currently monitoring token costs and LLM hallucinations in production? Are you using raw vendor dashboards, or have you migrated to OpenTelemetry? Drop your stack in the comments below.